7 Best Open Source Network Monitoring Tools for 2026
In the complex ecosystem of modern IT, “downtime” is the ultimate enemy. Whether you are managing a small office network or a sprawling enterprise data center, flying blind is not an option. You need to know when a server goes offline, when bandwidth spikes, or when a router is overheating—preferably before your users start calling to complain.
For many businesses in 2026, IT budgets are tighter than ever. Expensive commercial monitoring suites (like SolarWinds or PRTG) offer polish and support, but they come with hefty licensing fees that can drain thousands of dollars from your annual budget.
This is where open source network monitoring tools shine. They offer enterprise-grade power for zero licensing cost. However, “free” comes with a caveat: you pay with your time. These tools often require more configuration and technical know-how than their paid counterparts.
If you are ready to trade some setup time for powerful, budget-friendly visibility, here are the 7 best open source network monitoring tools dominating the industry in 2026.

1. Zabbix: The Enterprise Standard
If you are looking for the heavy hitter of the open-source world, Zabbix is widely considered the king. It is a mature, enterprise-class platform that can monitor anything from network switches and servers to virtual machines and cloud services.
Key Features:
- Agent & Agentless Monitoring: You can install a lightweight agent on servers for deep metrics, or use SNMP to monitor routers and switches without agents.
- High Scalability: Zabbix can handle networks with thousands of devices.
- Visualizations: It includes built-in graphing, maps, and dashboards, though many users integrate it with Grafana for a prettier look.
Why choose it in 2026?
Zabbix continues to release massive updates. Its latest versions have improved auto-discovery and native integration with cloud platforms like AWS and Azure. If you want a “do-it-all” tool and don’t mind a steep learning curve, this is the one.
Zabbix continues to release massive updates. Its latest versions have improved auto-discovery and native integration with cloud platforms like AWS and Azure. If you want a “do-it-all” tool and don’t mind a steep learning curve, this is the one.
Best For: Medium to Large Enterprises.
2. Prometheus: The Cloud-Native Champion
Prometheus has exploded in popularity alongside the rise of Kubernetes and microservices. Unlike traditional tools that ask “is this server up?”, Prometheus is built to scrape metrics from applications and infrastructure in real-time.
Key Features:
- Time-Series Database: It is built specifically to handle massive amounts of numeric data (metrics) over time.
- Pull Model: Unlike other tools that “push” data to a server, Prometheus “pulls” (scrapes) data from your targets.
- AlertManager: A robust system for handling alerts and routing them to Slack, email, or PagerDuty.
The Catch:
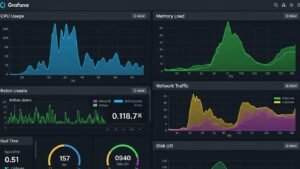
Prometheus is not great at visualization out of the box. It is almost always paired with Grafana, a visualization tool that turns Prometheus data into beautiful, dark-mode dashboards.
Prometheus is not great at visualization out of the box. It is almost always paired with Grafana, a visualization tool that turns Prometheus data into beautiful, dark-mode dashboards.
Best For: DevOps teams, Kubernetes environments, and modern app monitoring.
3. Nagios Core: The Reliable Veteran
Nagios is the “grandfather” of network monitoring. Launched in 1999, it is still running the infrastructure of countless Fortune 500 companies. Nagios Core is the free, open-source version.
Key Features:
- Plugin Ecosystem: The most significant advantage of Nagios is its robust plugin ecosystem. If you need to monitor a specific, obscure piece of hardware, someone has likely already written a plugin for it.
- Alerting: It is famous for its aggressive alerting capabilities.
- Stability: It is rock solid. It rarely crashes.
The Downsides:
The interface of Nagios Core looks outdated (think Windows 95 aesthetics). Configuration is notoriously tricky, requiring manual editing of text files. It is not for the faint of heart, but it is incredibly powerful.
The interface of Nagios Core looks outdated (think Windows 95 aesthetics). Configuration is notoriously tricky, requiring manual editing of text files. It is not for the faint of heart, but it is incredibly powerful.
Best For: Sysadmins who love command lines and stability over pretty interfaces.
4. LibreNMS: The User-Friendly Choice
If Nagios sounds too tricky, LibreNMS is the antidote. It is a fully featured network monitoring system that emphasizes ease of use and automation. It is a “fork” (spin-off) of another tool called Observium.
Key Features:
- Auto-Discovery: This is its killer feature. You point LibreNMS at your network, and it automatically finds devices, identifies them (Cisco, Juniper, Linux, Windows), and starts monitoring them via SNMP.
- Mobile App: It has a decent mobile app for on-the-go monitoring.
- API Support: It integrates well with other tools like Discord, Slack, and ticketing systems.
Why choose it in 2026?
LibreNMS is arguably the best “set it and forget it” tool for physical network gear. Its mapping feature, which automatically connects your switches, is invaluable.
LibreNMS is arguably the best “set it and forget it” tool for physical network gear. Its mapping feature, which automatically connects your switches, is invaluable.
Best For: Network Engineers managing physical hardware (switches/routers).

5. Icinga 2: The Modern Nagios
Icinga started as a fork of Nagios but has since evolved into its own distinct, modern beast. It was built to solve the scalability and configuration issues of the original Nagios.
Key Features:
- Object-Oriented Configuration: Unlike Nagios’s flat text files, Icinga uses a dynamic configuration language that is much easier to manage at scale.
- REST API: It has a robust API that allows you to update configurations on the fly.
- Modular Architecture: It separates the monitoring core from the web interface, improving performance.
Best For: Teams that like Nagios’s logic but want modern features and a cleaner interface (Icinga Web 2).
6. Cacti: The Graphing Specialist
Cacti are different. While it can send alerts, its primary purpose is graphing. It is a frontend for RRDTool (Round Robin Database Tool). It is designed to poll devices via SNMP and draw historical graphs of the data.
Key Features:
- Bandwidth Tracking: Cacti is the industry standard for tracking bandwidth usage over time. If you want to know “Did my internet slow down last Tuesday at 4 PM?”, Cacti will have the graph.
- User Management: It has granular user permissions, allowing you to give specific clients access to view only their own graphs.
The Downsides:
It is not a great “alerting” system compared to Zabbix or Nagios. It is best used as a companion tool for deep historical analysis of network traffic.
It is not a great “alerting” system compared to Zabbix or Nagios. It is best used as a companion tool for deep historical analysis of network traffic.
Best For: ISPs (Internet Service Providers) and data centers needing bandwidth logs.
7. OpenNMS: The Scalability Monster
OpenNMS is an enterprise-grade network management application platform. It differs from others on this list because it is event-driven and designed for massive scale—we are talking tens of thousands of devices.
Key Features:
- Minion: An optional distributed monitoring feature that allows you to monitor devices in different geographic locations from a central server.
- Event Management: It excels at reducing “noise” by correlating events (e.g., if a main router goes down, it suppresses alerts for all the devices behind it, so you don’t get 500 emails at once).
Best For: Large enterprises and Telecom companies.

How to Choose the Right Tool
With so many excellent open-source network monitoring tools available, how do you choose? Here is a quick decision matrix:
- Do you want an all-in-one solution? Go with Zabbix. It does everything well and has a vast community.
- Are you monitoring a modern app/Kubernetes? Go with Prometheus + Grafana.
- Are you a Network Engineer focusing on switches? Go with LibreNMS. The auto-discovery will save you hours.
- Do you need simple bandwidth graphs? Go with Cacti.
- Do you have zero budget but unlimited technical skill? Go with Nagios Core.
Conclusion
In 2026, you do not need to spend a fortune to get professional-grade visibility into your network. Whether you choose the modern flexibility of Prometheus or the battle-hardened stability of Zabbix, open source software offers a solution for every need.
The most crucial step is to start. Download one of these tools, install it on a virtual machine, and let it scan your network. You might be surprised—and perhaps a little worried—by what you find.


 Against Ransomware")
")


 Against Ransomware")
")